Introduction
John Tukey’s stem-and-leaf plot first appeared in 1970. Although very useful back then, it cannot handle more than 300 data points and is completely text-based. Stemgraphic is a very easy to use python package providing a solution to these limitations.
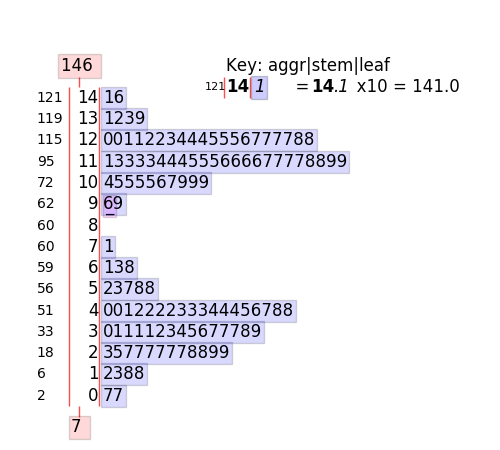
A typical stem_graphic output:
For an in depth look at the algorithms and the design of stemgraphic, see
A PDF version of the documentation is available at: http://stemgraphic.org/doc/stemgraphic.pdf
The official website of stemgraphic is: http://stemgraphic.org
Installation
Stemgraphic requires docopt, matplotlib, pandas and seaborn. Optionally, having Scipy installed will give you secondary plots, cufflinks for interactive plots and Dask (see requirements_dev.txt for all needed to run all the functional tests) will allow for out of core, big data visualization.
If you use conda, it is recommended you conda install docopt, matplotlib, pandas, seaborn, and scipy before doing a pip install of stemgraphic.
Installation of stemgraphic is simple:
pip3 install -U stemgraphic
or from a clone of the github repository, in the package root:
python3 setup.py install